Attendance
Attendance provides a deeper insight into employees’ attendance trends, breaks and working patterns through colourful widgets, graphs and tables. Attendance feature has 3 views: Summary, Detailed and Date-wise Attendance:
Summary view
The attendance summary view collates the summary presence statistics for the organization. This module is useful for viewing overall attendance metrics for the organization.
Filters
With the help of Teams and Date range filters, admin has the flexibility to access the insights of any team on any date range. And with the download button admin can download these insights in PDF format. By default, the team filter is set to the entire organization and the date range filter is set to “Last 7 days”
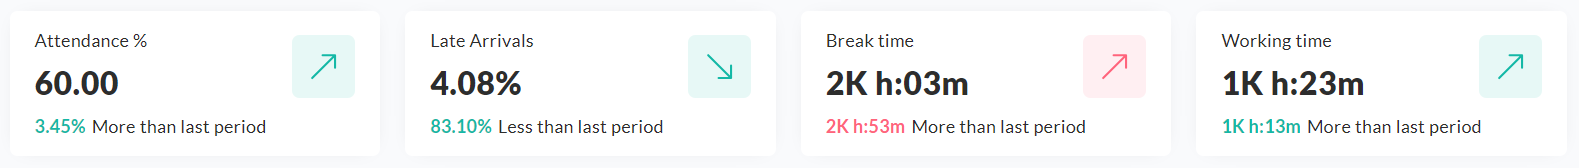
Metric cards
The attendance metric cards display attendance %, late arrivals %, total break time and total working time. They also display the movement of the metric in the previous period. For ex. Attendance % for the last 7 days is 25% more than the last period i.e. previous 7 days.
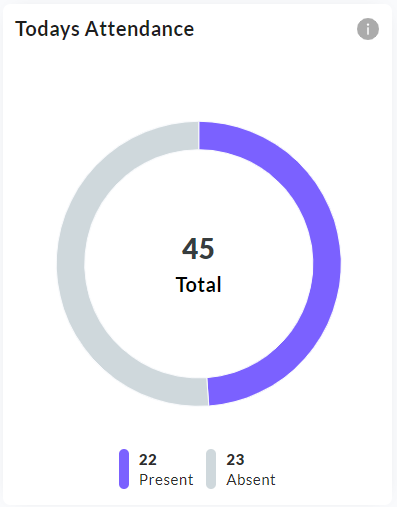
Today’s attendance widget
This widget always displays today’s attendance and is not impacted by changing date filters. Team filters apply.
Attendance trends
This bar graph shows the trend of present/absent figures over the filtered date range.
Break trends
This line graph displays the trend of total break time taken by the filtered team over the filtered date range.
Late Arrival Tendency
This grouped bar graph shows the number of late and on-time arrivals within the applied filters
Attendance Detail
The attendance detail view displays the attendance trends and detailed table containing relevant stats. This module is useful for viewing detailed attendance metrics for the organization.
Filters
The attendance summary page provides the Team filter, users filter and date range filter which allows admins to filter data as needed.
Trend Graph
Detailed Table
The detailed table view displays the list of employees as per the applied filters. For each employee, attendance, working time, online time and break time are listed as well as a view calendar button is provided. Upon clicking the view calendar button, a modal popup shows the present/absent stats for the month.
Datewise Attendance
In this view, Admins/managers can see the present/absent statistics for a particular day.
Present employees are arranged in a list on the left and absent employees on the right.
For each present employee, the in/out timings are also displayed.
Please note that for each day, only in timings will be visible for present employees who have not checked out yet. Also, the in/out timings displayed are the first In/ last out timings, i.e., if a present employee has punched in/out several times during the day then the timing of the first punch-in and the last punch-out will be displayed in this list.
Related Articles
Reports
Reports We360.ai offers an extensive reporting feature, allowing you to delve into your employees' data, such as stats, attendance, breaks, work patterns, productivity, and more. What's even better is that you can easily download each report from the ...Time calculation
Attendance Metric Description Formula Attendance % When selected date range is 1, total employees present/ total employee strength When selected date range is >1, total employees present/total employee strength averaged over the date range When ...Employee Scorecard
Just as the name says, it’s a complete scorecard of employees' performance. One place to see all the working analytics of an employee in a month. Compare the employee’s performance and see how well that employee is performing with the respective team ...Filters & Pin filters
Filters Introduction Filters are powerful tools within each feature of We360, designed to streamline your search process and help you find exactly what you're looking for. Whether you're analyzing team performance, group metrics, or individual user ...Dashboard
We360.ai dashboard displays an organization’s work highlights. It uses effective graphs to visualize employee presence and work trends. Once you land on the dashboard, you can get an overview of attendance, activity, and productivity trends ...